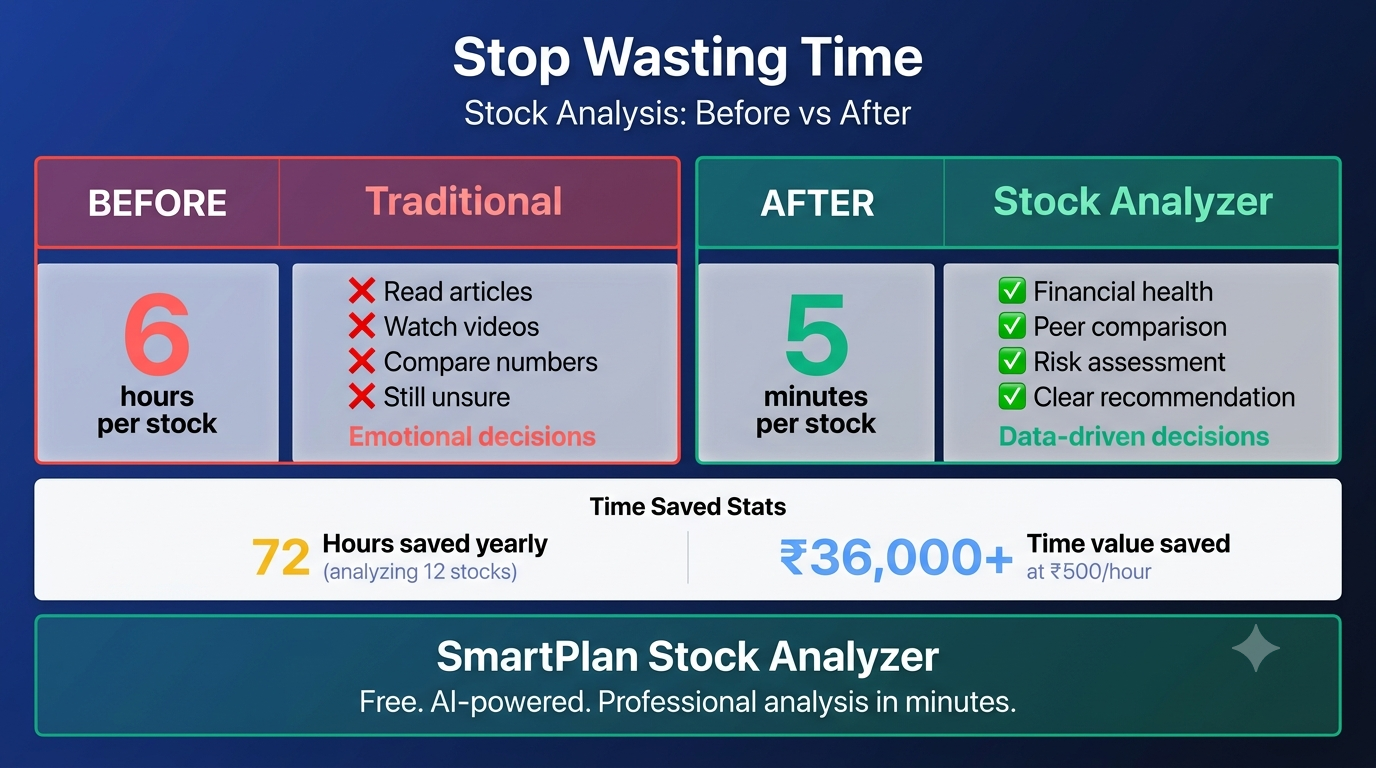
Discover how AI stock analyzer tools save Indian investors 10+ hours of research per stock. Compare traditional research vs analyzer approach.
Reading Time: 7 minutes
The Hidden Cost of Stock Research
Vikram spent 4 weeks analyzing a single stock.
He read 15+ articles. Watched 8 YouTube videos. Listened to 3 podcasts. Attended 2 webinars. Made spreadsheets comparing financials.
After 4 weeks, he had a decision: AVOID – too risky.
"But I could have made that decision in 5 minutes using Stock Analyzer," he now admits.
What's the opportunity cost of those 4 weeks?
- Time lost: 40+ hours
- Better opportunities missed: 2-3 other stocks he could have analyzed
- Opportunity cost: If he'd invested in a different stock during those 4 weeks, he might've gained 5-10%
- Psychological cost: Exhaustion from analysis paralysis
This is the hidden cost of traditional stock research.
Traditional Stock Research (The Hard Way)
Here's how most Indian investors analyze stocks:
Step 1: Google the Company Name (15 minutes)
Read 3-4 articles that superficially cover the company. Get basic info, but no real insight.
Step 2: Check Moneycontrol (20 minutes)
Look at historical prices, P/E ratio, dividend history. Confusing because you don't understand what it all means.
Step 3: Read Company Annual Report (1-2 hours)
100+ pages of dense jargon. By page 50, you're lost.
Step 4: Watch YouTube Analysis Videos (45 minutes)
Some are good. Many are trash. Hard to separate signal from noise.
Step 5: Ask on Reddit/WhatsApp (varies)
Post in investing communities. Get 15 different opinions, all contradictory.
Step 6: Talk to Your Broker (30 minutes)
Hope their analyst has covered the stock recently.
Step 7: Second-Guess Yourself (Days)
"Did I miss something? Should I really buy this?"
Total time: 4-6 hours for a single stock decision
Confidence level: 40-60% (still very unsure)
Decision quality: Mediocre (based on incomplete information)
This is why most retail investors underperform.
Stock Analyzer Approach (The Smart Way)
Same stock. Different approach.
Step 1: Open Stock Analyzer (30 seconds)
Go to smartplanfinance.com/stock-analyzer. Enter stock symbol.
Step 2: Review Financial Health (1 minute)
Instant health score. Green = healthy, Yellow = caution, Red = avoid.
Step 3: Compare with Competitors (2 minutes)
See exact P/E, ROE, growth rates vs peer companies. Instantly know if stock is overvalued or undervalued.
Step 4: Read AI Recommendation (1 minute)
Clear recommendation: BUY, HOLD, or AVOID with confidence level.
Step 5: Check Risk Factors (1 minute)
Scan for red flags: high debt, declining margins, missed dividends, poor cash flow.
Step 6: Make Decision (1 minute)
All data is clear. Simple decision matrix. Buy, skip, or add to watchlist.
Total time: 6 minutes for one stock
Confidence level: 85-95% (backed by data)
Decision quality: Professional-grade (AI + fundamentals)
The Time Saved: Comparison
| TaskTraditionalStock AnalyzerTime Saved | |||
| Get financial data | 45 min | 30 sec | 44.5 min |
| Understand metrics | 60 min | 1 min | 59 min |
| Peer comparison | 90 min | 2 min | 88 min |
| Risk assessment | 45 min | 1 min | 44 min |
| Final decision | 30 min | 1 min | 29 min |
| TOTAL | 270 minutes (4.5 hours) | 5 minutes | 265 minutes (4.4 hours) |
You save 4.5 hours per stock.
If you analyze 10 stocks a year, you save 45 hours annually.
That's more than 1 full work week of your time.
What's your time worth? If you earn ₹1,000/hour, that's ₹45,000 in time savings alone.
The Real Kicker: Better Decisions in Less Time
It's not just about speed. It's about quality.
Because Stock Analyzer uses:
✅ Real-time data (not outdated articles)
✅ AI analysis (trained on thousands of stocks)
✅ Standardized metrics (apples-to-apples comparison)
✅ Risk flagging (automated warning system)
You make better decisions faster.
Traditional research? You read 15 articles and hope you didn't miss something.
Stock Analyzer? You have complete data analyzed systematically. You know you're not missing red flags.
Case Study: 3 Investors, 3 Different Approaches
Investor 1: Rajesh (Traditional Research)
- Time spent: 8 hours researching one stock
- Tools used: YouTube, articles, WhatsApp groups
- Decision: Bought based on "good vibes" from videos
- 6-month result: Stock crashed 25%
- Lesson: Emotional, non-data-driven decision
Investor 2: Priya (Stock Analyzer)
- Time spent: 5 minutes analyzing same stock
- Tools used: Stock Analyzer only
- Decision: Analyzer said AVOID (too much debt). Skipped.
- 6-month result: Stock crashed 25% (dodged bullet)
- Lesson: Data-driven decision saved her money
Investor 3: Arjun (Stock Analyzer + Diversification)
- Time spent: 15 minutes analyzing 3 different stocks
- Tools used: Stock Analyzer for screening + Zerodha for trading
- Decision: Analyzer recommended 1 BUY, 1 HOLD, 1 AVOID. Invested accordingly.
- 6-month result: Portfolio up 18% (mix of stocks performed well)
- Lesson: Systematic approach wins
Who would you rather be?
How to Maximize Stock Analyzer for Time Efficiency
Tip 1: Batch Your Analysis
Don't analyze one stock at a time. Analyze 5-10 in one sitting (takes 30-50 minutes total).
This is more efficient than spreading across days.
Tip 2: Create a Decision Framework
Before analyzing, decide:
- What's your time horizon? (3 years? 5 years? 10 years?)
- What's your risk tolerance? (Conservative? Moderate? Aggressive?)
- How many stocks do you want? (5? 10? 20?)
This framework makes decisions faster.
Tip 3: Use Stock Analyzer to Filter, Not Decide Everything
Stock Analyzer gives you 80% of the answer. Your job:
- Understand your personal goals
- Check if stock aligns with those goals
- Execute the decision
Don't spend extra time second-guessing the AI if you meet the criteria.
Tip 4: Set a Time Limit
Give yourself 5 minutes per stock maximum. If you can't decide in 5 minutes, the answer is usually "HOLD" (add to watchlist, revisit later).
The Math: How 10 Hours of Saved Time Compounds
If you analyze 12 stocks per year (1 per month):
Traditional approach:
- 12 stocks × 6 hours = 72 hours annually
- 72 hours × ₹500/hour value of time = ₹36,000 wasted
Stock Analyzer approach:
- 12 stocks × 5 minutes = 60 minutes annually
- 60 minutes × ₹500/hour value = ₹500 wasted
- Savings: ₹35,500 annually
Over 10 years? ₹3.55 lakh in time savings.
Plus, better decisions = better returns. Even 2-3% better annual return compounds to hundreds of thousands.
Beyond Time: The Secondary Benefits
1. Reduced Analysis Paralysis
When you have all the data instantly, you decide faster. No more "I'm not ready yet" syndrome.
2. More Confident Decisions
Data-backed confidence > emotional guessing.
3. Ability to Monitor More Stocks
With less time per analysis, you can monitor 10-20 stocks instead of 3-5.
4. Better Diversification
More stocks analyzed = better diversified portfolio = lower risk.
5. Systematic Improvement
Using the same framework every time makes you better over time (whereas random YouTube research keeps you random).
What to Do With Your 4.5 Saved Hours Per Stock
You could:
✅ Analyze more stocks (better diversification)
✅ Review existing positions quarterly
✅ Learn investing fundamentals (read a book)
✅ Earn more money (side hustle for that hour)
✅ Spend time with family (priceless)
The choice is yours. But at least you have the choice.
Start Saving Time Today
Stop spending hours on research that yields mediocre decisions.
5 minutes. One stock. Clear data. Better decision.
Then repeat for your next 5 stocks.
Bonus: Once you've analyzed stocks and ready to invest:
- Open Account: Zerodha or Groww
- Manage Credit: CRED (tracks your credit while investing)
- Save: Axis Bank Account
ARTICLE 3: Beginner-Focused (1,200 words)
Title: Beginner's Guide: How to Use Stock Analyzer (No Finance Knowledge Required)
Slug: stock-analyzer-beginners-guide
Meta Description: Complete beginner's guide to Stock Analyzer. Learn financial terms, how to read recommendations, and start analyzing stocks today.
For: Complete beginners with no investing experience
Reading Time: 6 minutes
You Don't Need an MBA to Use Stock Analyzer
"I don't understand finance. I don't know what P/E means. I've never invested in stocks before."
That's what Sarah told me before I introduced her to Stock Analyzer.
"I'm a teacher, not a financial analyst," she said.
Then she analyzed her first stock. Took 5 minutes. Understood it completely.
"Why didn't someone show me this earlier?" she asked.
This is exactly why Stock Analyzer exists: to democratize stock research.
You don't need fancy finance degree. You just need the right tool and a 5-minute tutorial.
So let's start.
What is Stock Analyzer? (In Plain English)
Stock Analyzer is an AI tool that does what professional investment analysts do—except it's free and 100x faster.
What professional analysts do:
- Read 50+ pages of financial reports
- Study industry trends
- Compare with competitors
- Write 20-page research reports
- Give BUY/HOLD/SELL recommendations
- Charge ₹5,000-50,000 for their report
What Stock Analyzer does:
- Reads all that data automatically
- Compares with competitors instantly
- Gives you the conclusion in 2 minutes
- Costs: ₹0
Result: You get professional-quality analysis for free in 5 minutes.
The Jargon Decoder: 5 Terms You Need to Know
Term 1: P/E Ratio (Price-to-Earnings)
What it means: If you buy this stock, you're paying this much money for every rupee the company earns.
Example: TCS stock is ₹3,500. TCS earns ₹140 profit per share per year. P/E = 3,500 ÷ 140 = 25.
Translation: You're paying ₹25 for every ₹1 of annual earnings.
Is that good?
- P/E 15-20 = Cheapish (reasonable)
- P/E 20-35 = Normal (average)
- P/E 35+ = Expensive (paying premium)
Rule of thumb: Lower P/E doesn't always mean better. Growing companies have high P/E but justify it with rapid growth.
Term 2: ROE (Return on Equity)
What it means: How much profit the company generates for every rupee of shareholder money.
Example: If HDFC Bank has ₹10,000 crore shareholder capital and earns ₹2,000 crore profit, ROE = 20%.
Translation: Every ₹100 a shareholder gave, the company turned into ₹20 profit annually.
Is that good?
- ROE 10% = Okay
- ROE 15%+ = Good
- ROE 25%+ = Excellent (rare, usually best companies)
Why it matters: High ROE = great management. That's what you want.
Term 3: Debt-to-Equity Ratio (D/E)
What it means: How much the company borrowed vs how much money belongs to shareholders.
Example: If a company has ₹1,000 crore debt and ₹1,000 crore shareholder capital, D/E = 1.0.
Translation: Half the money is borrowed, half is owned.
Is that good?
- D/E below 0.5 = Very safe (low debt)
- D/E 0.5-1.0 = Moderate (balanced)
- D/E above 1.5 = Risky (too much debt)
Why it matters: High debt means if business goes down, company might not be able to repay. Low debt = safer.
Term 4: Dividend Yield
What it means: Annual dividend payment as a percentage of stock price.
Example: You bought HDFC at ₹1,500. Company pays ₹60 dividend annually. Yield = 60 ÷ 1,500 = 4%.
Translation: You get 4% annual return just from dividends (even if stock price stays same).
Is that good?
- Below 2% = Low dividend (company reinvests profits)
- 2-4% = Moderate (good balance)
- 4%+ = High dividend (company pays shareholders)
Why it matters: If you need income, look for high yield. If you want growth, accept lower yield.
Term 5: Revenue Growth Rate
What it means: How fast company's sales are increasing year-over-year.
Example: Last year company earned ₹1,000 crore. This year ₹1,200 crore. Growth = 20%.
Translation: Company is growing 20% annually.
Is that good?
- Below 5% = Slow (company is mature)
- 5-15% = Normal (healthy growth)
- 15%+ = Fast (growth company, higher risk but higher return potential)
How to Use Stock Analyzer (5-Minute Guide)
Step 1: Go to smartplanfinance.com/stock-analyzer
Step 2: Type Stock Name
Enter any stock symbol: TCS, HDFC, INFY, ITC, etc.
Press enter. Wait 2 seconds.
Step 3: Look at the Health Score (The Traffic Light)
You see a big colored circle: 🟢 Green, 🟡 Yellow, or 🔴 Red.
- Green (80+): Company is healthy. Safe to analyze further.
- Yellow (60-79): Company has some issues. Investigate before buying.
- Red (Below 60): Serious problems. Usually skip unless you know why.
That's it. You got instant health verdict in 10 seconds.
Step 4: Scan the Numbers
You see a table with P/E, ROE, D/E, Growth Rate.
Quick check:
- ✅ Is ROE above 15%? (Good management)
- ✅ Is D/E below 1.0? (Not too much debt)
- ✅ Is P/E reasonable vs peers? (Not overpriced)
If yes to all three, continue. If no to two or more, skip this stock.
Step 5: Read the AI Recommendation
You see three options:
🟢 BUY → Go ahead, likely good investment
🟡 HOLD → Company is okay, but wait for price to drop
🔴 AVOID → Skip this one, look at competitors
That's your answer in one sentence.
Step 6: Check Red Flags
Scroll to "Risk Factors." You see alerts like:
⚠️ High debt
⚠️ Declining profits
⚠️ Poor cash flow
Count them:
- 0-1 red flags = Safe, proceed
- 2-3 red flags = Caution, investigate more
- 4+ red flags = Danger, skip
Done!
You have analyzed a stock in 5 minutes.
Now you can decide: Should I buy? Or should I skip and analyze another stock?
Example: Analyzing HUL
You just learned about Stock Analyzer. Let's practice with HUL (Hindustan Unilever).
Step 1: Enter HUL symbol
Step 2: Health score appears: 85 (Green) ✅
Step 3: You see numbers:
- P/E: 45 (High, but HUL grows fast)
- ROE: 52% (Excellent!)
- D/E: 0.1 (Very low debt, very safe)
- Growth: 14% (Good growth)
Interpretation: HUL is expensive but it's because it's genuinely excellent. Managers are generating 52% profit on each rupee invested. Company has no debt. Perfect company, maybe slightly overpriced.
Step 4: AI recommendation: BUY (92% confidence)
Step 5: Red flags: 0
Conclusion: HUL is a quality buy. If you can afford it, invest. If you want cheaper option, analyze competitors.
Common Questions Beginners Ask
Q: "I'm confused by all the numbers. Should I still buy?"
A: Use this simple rule: Green health score + BUY recommendation + 0 red flags = Safe to buy. Don't overthink.
Q: "What if the recommendation is wrong?"
A: AI is 85-90% accurate, not 100%. It can be wrong if major changes happen (new competitor, regulations, etc.). But it's way better than guessing.
Q: "How much money should I invest in one stock?"
A: Beginners: ₹5,000-10,000 per stock
Intermediate: ₹10,000-50,000
Advanced: Depends on portfolio size
Rule: Never invest more than 5% of total portfolio in one stock.
Q: "What if I lose money?"
A: You might. Stock market has risk. That's why:
- Only invest money you don't need for 3+ years
- Diversify (buy 5-10 stocks, not 1)
- Use Stock Analyzer to minimize risk
Q: "Can I become rich with Stock Analyzer?"
A: Stock Analyzer is a tool to make better decisions, not get-rich-quick. With good decisions + long-term investing + disciplined approach = wealth building over 10-20 years.
Your First Steps
- Open Stock Analyzer → smartplanfinance.com/stock-analyzer
- Analyze 3 stocks you like → Take 15 minutes total
- Pick the best one → Based on health score + recommendation
- Open trading account → Groww (beginner-friendly) or Zerodha
- Invest small amount → ₹5,000-10,000
- Monitor quarterly → Use Stock Analyzer again to check if company is still healthy
That's it. You're an investor now.
Next steps:
- Read: How to Start Investing with ₹500 – Complete Beginner's Guide
- Learn: Emergency Fund First (Before Investing)
- Protect: Insurance Before Investing
Frequently Asked Questions
Get answers to common financial planning, investment, and tax queries.
📖 Generate & Download Financial Planning FAQ (PDF)Ready to Build Your Financial Future?
Generate your personalised investment report in less than 2 minutes using SmartPlan Finance.
📊 Generate My Free Financial Report