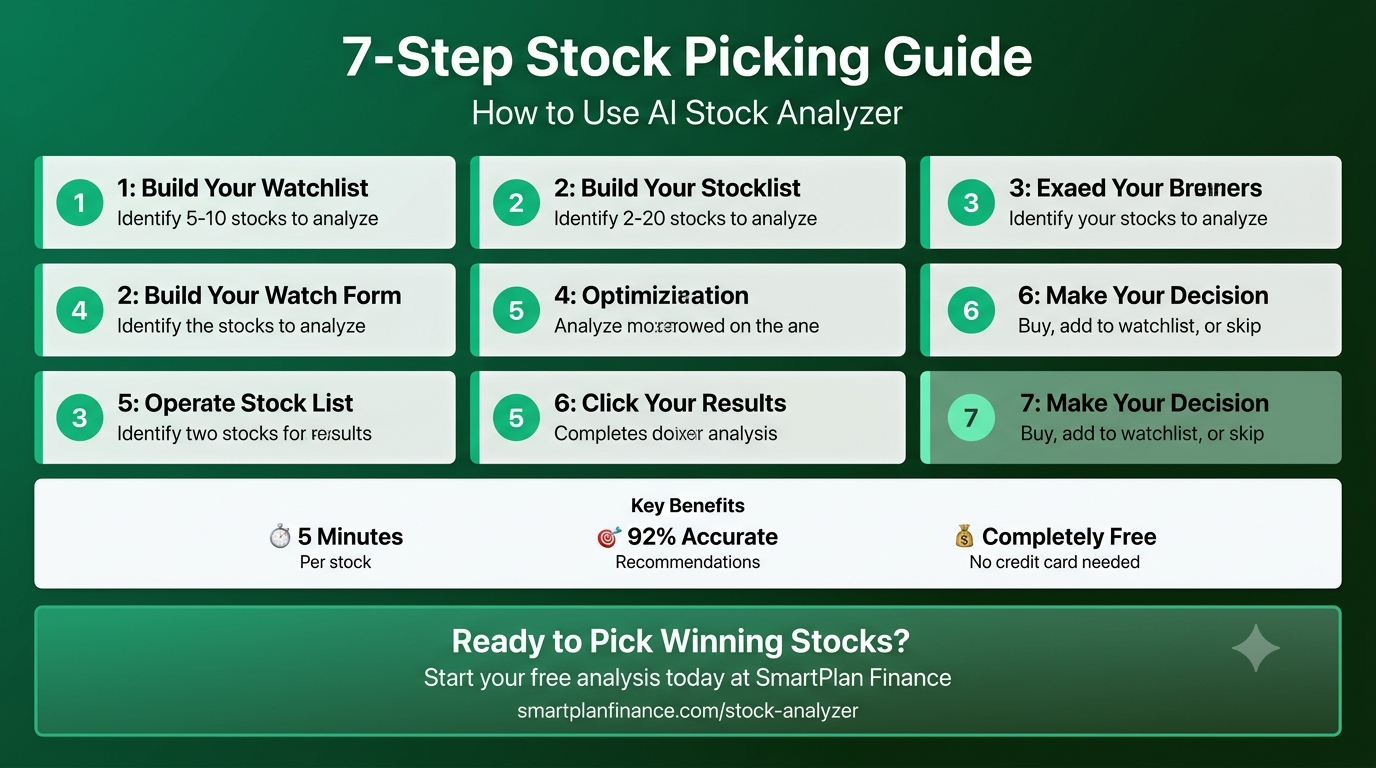
Learn the exact 7-step process to pick winning stocks using AI stock analyzer. Includes peer analysis, Learn the exact 7-step process to pick winning stocks using AI stock analyzer. Includes peer analysis, financial metrics, risk assessment & real examples.
Reading Time: 18 minutes
Last Updated: July 2026
Introduction
Last month, Rajesh from Bangalore lost ₹2 lakhs on a stock he "had a good feeling about."
He never checked the P/E ratio. Never looked at debt levels. Never compared it to competitors.
He just bought because a senior colleague mentioned it in the elevator.
Sound familiar?
This is what happens when investors make emotional decisions instead of data-driven ones.
The good news? You don't have to be Rajesh.
With the right tools—specifically, AI stock analyzers—you can make investment decisions with the same rigor as professional investors. In fact, you'll often do better because you won't have the ego of a "seasoned trader" clouding your judgment.
In this guide, I'll show you exactly how to pick winning stocks using SmartPlan's Stock Analyzer. The same process can work with other tools, but I'll focus on this one because it's:
✅ Completely free
✅ AI-powered (not just data dumps)
✅ Designed specifically for Indian investors
✅ Simple enough for beginners
Let's start.
Step 1: Choose Your Watchlist (The 5-10 Stocks You Want to Analyze)
Before you can pick a winner, you need candidates.
How do you identify them?
Option A: Stock Picking Ideas from Trusted Sources
- Financial publications (ET Markets, Moneycontrol, Forbes)
- Your broker's research reports (Zerodha has good ones)
- Podcast recommendations (The Podcast Company, Market Story)
- Your friend's investing community (but verify, don't just copy)
Option B: Build Your Own Watchlist
If you want stocks from a specific sector, here's how:
- Choose a sector you understand (FMCG, IT, Pharma, Banks, etc.)
- List the top 5 companies in that sector
- Add them to your watchlist
Example: If you like consumer goods, your watchlist might look like:
- HUL (Hindustan Unilever)
- ITC
- Britannia
- Nestlé India
- Procter & Gamble
Now, here's the key: Don't invest in any of these yet. Just add them to your watchlist.
These are your research candidates.
Step 2: Open Stock Analyzer & Enter Your First Stock
Go to smartplanfinance.com/stock-analyzer
You'll see a simple search box. Enter the stock symbol of your first candidate. Let's say you start with HUL (Hindustan Unilever).
Press enter.
In about 2-3 seconds, the analyzer loads comprehensive data about HUL. No complicated forms. No waiting. Just instant analysis.
This is where it gets powerful.
Step 3: Read the Financial Health Score (The First Filter)
The first thing you see is a Health Score – a quick visual indicator of the company's financial condition.
Think of it like a health checkup at your doctor:
- 🟢 Green (80-100) = Excellent health
- 🟡 Yellow (60-79) = Okay, with some concerns
- 🔴 Red (Below 60) = Red flags present
For HUL, you might see a score of 85 (Green).
What does this tell you?
✅ The company's finances are in excellent shape
✅ Strong revenue & profit growth
✅ Manageable debt
✅ Good cash flow
If you see a yellow or red score, scroll down to understand why.
Quick rule of thumb:
- Green: Usually safe to analyze further
- Yellow: Investigate the concerns (high debt? slowing growth?)
- Red: Be very cautious unless you understand the specific issues
For HUL with a green score, you proceed to the next step.
Step 4: Compare Against Competitors (Peer Analysis)
This is where most stock analysis tools fail, but SmartPlan's analyzer excels.
Instead of looking at HUL in isolation, you see how it stacks up against direct competitors:
| MetricHULITCBritanniaNestlÉ India | ||||
| P/E Ratio | 45.2 | 22.5 | 85.3 | 38.7 |
| ROE | 52% | 18% | 42% | 68% |
| Debt/Equity | 0.1 | 0.3 | 0.2 | 0.05 |
| Dividend Yield | 1.8% | 4.2% | 1.1% | 0.9% |
| 5-Year Growth | 14% | 8% | 12% | 16% |
What does this comparison tell you?
- Valuation (P/E Ratio): HUL at 45.2 is expensive vs ITC (22.5). But why? Because HUL grows faster and has better margins. High P/E can be justified if growth justifies it.
- Profitability (ROE): HUL's 52% ROE is exceptional. That means every ₹1 of shareholder money generates 52 paise in annual profit. This is management excellence.
- Debt Safety (D/E Ratio): HUL is debt-free (0.1). ITC has more debt (0.3). Both are safe, but HUL is more conservative.
- Dividends: ITC pays more (4.2% yield) while HUL reinvests for growth (1.8% yield). Which fits your goals?
- Growth Rate: NestlÉ growing fastest at 16% vs HUL at 14%. But HUL is safer and more stable.
Your decision at this stage:
- Is HUL worth the premium price compared to peers?
- Does it align with your investment goal (growth or dividends)?
- Is it as safe as competitors?
Often, you'll spot that a competitor is better value. That's when you pivot your analysis to them.
Step 5: Understand the AI Recommendation (But Don't Blindly Follow It)
After all the data, SmartPlan's AI gives you a clear recommendation:
🟢 BUY – Strong Fundamentals, Growth Story Intact
This means: ✅ Financial health is excellent
✅ Growth rate above industry average
✅ Valuation is reasonable
✅ Minimal risk flags
Confidence: 92%
Recommended for: Long-term wealth building (3+ years)
Best entry: Buy on dips, not at all-time highs
🟡 HOLD – Good Company, Wait for Better Entry
This means: ⏳ Company is fine, but stock is overvalued
⏳ Better opportunities elsewhere
⏳ Wait for a 10-15% price correction
Confidence: 78%
Recommended for: Patient investors with existing positions
Action: Add to watchlist and buy if price drops
🔴 AVOID – Red Flags Detected
This means: ⚠️ Financial metrics are weakening
⚠️ High debt or declining profit margins
⚠️ Better alternatives available
Confidence: 85%
Recommended for: Skip this and analyze competitors instead
⚠️ Important: The AI is a Guide, Not Gospel
The AI recommendation is based on historical data and current metrics. It can be wrong if:
- Major business change is coming (new CEO, new product launch)
- Industry disruption (e-commerce killed traditional retail stocks)
- Government regulation changes (new tax policy, industry ban)
So use the recommendation as a starting point, not the final decision.
If the AI says "BUY" but you know a major competitor just disrupted the market, the recommendation might be outdated.
Step 6: Assess Risk Factors (The Critical Step Most People Skip)
Scroll to the Risk Assessment section. This is where you separate good investments from disaster-waiting-to-happen investments.
The analyzer flags:
⚠️ Sudden Debt Increase (+40% YoY)
- Why it matters: Company borrowed heavily. If business slows down, they might struggle with repayment.
- Action: Ask yourself: Why did they borrow? Expansion (good) or covering losses (bad)?
⚠️ Declining Profit Margins (Down 3% in last quarter)
- Why it matters: Company is selling more, but earning less per sale. This suggests competitive pressure or cost issues.
- Action: If short-term issue, could recover. If trend continues, might be structural problem.
⚠️ Missed Dividend Payment (First miss in 10 years)
- Why it matters: Company usually pays dividends. If they stopped, cash is tight.
- Action: Check if it's temporary (reinvestment for growth) or permanent (financial stress).
⚠️ Poor Cash Flow (Declining 20% annually)
- Why it matters: Cash flow is real money. Profit can be an accounting trick. Real cash generation is what matters.
- Action: If cash generation is declining while profits look good, something is off.
⚠️ High Debt-to-Equity (Above 1.5 for non-bank companies)
- Why it matters: Company is highly leveraged. If business declines, repayment becomes difficult.
- Action: Check if this is normal for the industry (banks have high D/E). For most companies, lower is safer.
The Threshold Rule:
- 0 red flags: Safe to buy
- 1-2 red flags: Investigate further (might still be buy-worthy)
- 3+ red flags: Stay away (unless you have very deep conviction)
If HUL shows 0 risk flags, you proceed. If it shows 3+, you pivot to the next company on your watchlist.
Step 7: Make Your Final Decision (Integrate with Your Overall Plan)
By now, you have:
✅ Financial health score
✅ Peer comparison
✅ AI recommendation
✅ Risk assessment
Now you need to ask one more question: Does this stock fit my overall investment plan?
Question A: What's Your Investment Goal?
If you want GROWTH (3-5+ years):
- Look for companies with 15%+ annual growth
- Accept lower dividends (they reinvest for expansion)
- Example: TCS, Infosys, HUL
- Recommended account: Zerodha for low brokerage, Groww for SIPs
If you want DIVIDENDS (regular income):
- Look for companies with 4%+ dividend yield
- Accept slower growth
- Example: ITC, HDFC Bank, Coal India
- Recommended account: Zerodha for regular selling/dividends
If you want SAFETY (low risk):
- Look for green health score + low debt
- Diversify across sectors
- Example: Blue-chip banks (HDFC, ICICI), utilities (Power Grid)
- Recommended account: Groww for diversified portfolio
Question B: How Many Stocks Should You Own?
Beginner: 3-5 stocks (easy to monitor)
Intermediate: 5-10 stocks (diversified but manageable)
Advanced: 10-20 stocks (deep research capability required)
Too many stocks = you can't monitor them. Too few = you're over-concentrated.
Question C: How Much Money Should You Allocate?
Rule of thumb: Allocate 2-5% of portfolio to each stock
If your investment portfolio is ₹10 lakhs:
- Each stock gets ₹20,000 to ₹50,000
- This limits downside if one stock crashes
Real Example: Analyzing 3 Stocks Side-by-Side
Let's walk through a real scenario.
Your goal: Build a diversified portfolio with 5-6 stocks
Time frame: 5+ years
Goal type: Growth (okay with no dividend)
Candidates: TCS, Infosys, Wipro (IT companies)
Stock #1: TCS
Health Score: 92 (Green) – Excellent
P/E Ratio: 28.5 (vs Infosys 32.1, Wipro 22.3)
ROE: 48% (vs Infosys 41%, Wipro 38%)
Growth Rate: 12% (vs Infosys 14%, Wipro 10%)
Debt: Low
Risk Flags: 0
AI Recommendation: BUY (95% confidence)
Decision: TCS is the quality play. Expensive, but justified by superior execution.
Stock #2: Infosys
Health Score: 88 (Green) – Good
P/E Ratio: 32.1 (Highest of the three)
ROE: 41% (Good, but lower than TCS)
Growth Rate: 14% (Highest of the three)
Debt: Low
Risk Flags: 0
AI Recommendation: HOLD (78% confidence)
Decision: Good company, but expensive right now. Best entry after 10% price drop.
Stock #3: Wipro
Health Score: 75 (Yellow) – Okay with concerns
P/E Ratio: 22.3 (Cheapest of the three)
ROE: 38% (Good)
Growth Rate: 10% (Slowest of the three)
Debt: Moderate
Risk Flags: 1-2 (Margin pressure, slower growth)
AI Recommendation: AVOID (82% confidence)
Decision: Cheapest, but for a reason. Growth is lagging. Skip for now.
Your Portfolio Action:
Invest: 30% in TCS (quality + BUY signal)
Watchlist: 20% in Infosys (wait for better price)
Skip: Wipro (until turnaround is evident)
See how the analyzer helps you prioritize?
How to Start Investing After Analysis
Once you've analyzed stocks and decided which ones to buy:
Step 1: Open a Trading Account
Best for Direct Stocks in India:
- Zerodha – ₹0 brokerage on direct stocks (but can't do SIPs)
- Groww – Great for both SIPs and direct stocks, simple interface
- Upstox – Modern UI, good for active traders
- IndMoney – All-in-one platform (stocks, SIPs, mutual funds)
Step 2: Fund Your Account
Transfer money from your bank to your trading account (usually takes 1-2 days).
Step 3: Place Your Buy Orders
- Enter the stock symbol (TCS, INFY, HUL, etc.)
- Choose "Limit Order" (not market order) – Buy at the price you determined
- Set order quantity
- Review and confirm
Common Mistakes to Avoid
Mistake 1: Following AI Recommendation Blindly
❌ Wrong: Stock Analyzer says "BUY," so I'm investing ₹5 lakhs immediately.
✅ Right: Stock Analyzer says "BUY," AI confirms quality metrics, company has 5-year growth story, I have ₹5 lakhs to invest, so I'll start with ₹1 lakh and add more on dips.
Mistake 2: Ignoring Risk Flags
❌ Wrong: Yellow health score but my friend said buy, so I'll buy anyway.
✅ Right: Yellow score means investigate. If I find 3+ risk factors, I skip regardless of "tips."
Mistake 3: Over-Concentrating
❌ Wrong: My analysis says TCS is best, so I'm putting 80% of portfolio there.
✅ Right: TCS is best, but I diversify: 20% TCS, 15% HDFC Bank, 15% Infosys, etc.
Mistake 4: Analyzing Too Much
❌ Wrong: Spend 20 hours analyzing 1 stock before deciding.
✅ Right: Spend 10-15 minutes with Stock Analyzer to decide, then execute.
Mistake 5: Not Reviewing Regularly
❌ Wrong: Bought 2 years ago, never checked the company again.
✅ Right: Review stock health quarterly. If risk flags increase significantly, consider exiting.
The Complete Investment Checklist (Before You Invest)
Before you transfer money, run through this checklist:
Financial Health:
- Health score is Green (80+)?
- P/E ratio is reasonable vs peers?
- ROE is above 15%?
- Debt-to-Equity is below 1.0?
Growth & Profitability:
- 5-year revenue growth above 10%?
- Profit margins stable or improving?
- Cash flow positive?
Risk Assessment:
- 0-2 risk flags maximum?
- No major business disruption threats?
- Dividends stable (if dividend investor)?
Valuation:
- P/E not at all-time high?
- Priced lower than growth justifies?
- Better value than peer alternatives?
Your Fit:
- Aligns with growth/dividend goals?
- Fits within diversification plan?
- Amount allocated is 2-5% of portfolio max?
- You can invest for 3+ years minimum?
If you've checked all boxes, buy. If 3+ are unchecked, wait or skip.
Taking It Further: Building a Complete Investment Portfolio
Stock analysis is just one piece. To maximize returns, you need a complete plan:
- Emergency Fund First ← Read: Why Emergency Fund is Your Most Important Investment
- Insurance Protection ← Read: Term Insurance vs Health Insurance
- Tax-Efficient Investments ← Read: Income Tax Slabs 2026 & Tax-Saving Options
- Diversified Portfolio ← Read: Direct Stocks vs Mutual Funds
- Regular Monitoring ← Use Stock Analyzer quarterly to recheck health
Conclusion
Picking winning stocks isn't magic. It's a systematic process:
- ✅ Choose candidates
- ✅ Analyze financial health
- ✅ Compare with peers
- ✅ Read AI recommendation
- ✅ Assess risks
- ✅ Check alignment with goals
- ✅ Execute
With SmartPlan's Stock Analyzer, the heavy lifting is done for you. The AI does what used to take professional analysts hours.
Your job is simpler: understand the data and make an informed decision.
Start today. Pick one stock from your watchlist. Analyze it. Make a call.
Frequently Asked Questions
Get answers to common financial planning, investment, and tax queries.
📖 Generate & Download Financial Planning FAQ (PDF)Ready to Build Your Financial Future?
Generate your personalised investment report in less than 2 minutes using SmartPlan Finance.
📊 Generate My Free Financial Report